In all likelihood, you have used a Likert scale (or something you’ve called a Likert scale) in a survey before.
It might surprise you to learn that Likert scales are a very specific type of survey question. What you have been calling “Likert” may be something entirely different.
Don’t worry—researchers who have done surveys for years still confuse their definitions. In fact, many researchers don’t agree on the best way to report on the numeric values in a Likert scale.
To try and clear up any confusion, we’ll take a look at the traditional and, in our opinion, most valuable way to use Likert scales and report on them using survey software.

What is a Likert Scale vs. a Likert Item
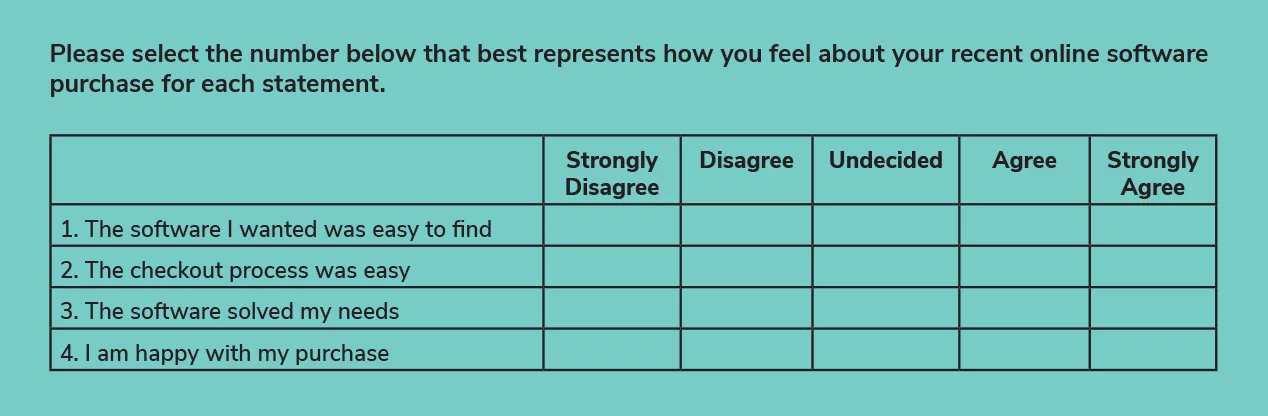
A “Likert scale” is the sum of responses to several Likert items. Visual aids like radio buttons or a horizontal bar typically display these items on a simple scale.
A survey asks the respondent to evaluate a statement called a “Likert item.” In the example below, the statement, “The checkout process was easy” is a Likert item. The table as a whole is the Likert scale.
Historic Trivia: Educator and psychologist Rensis Likert invented the Likert scale question in his thesis at Columbia University. You never know when this might come up in Market Research Trivia night at your local bar.
Here’s an easy way to remember the distinction. The “scale” in “Likert scale” refers to the total sum of all Likert items in the question. It does not refer to the 1-5 range you see associated with each item. In our example above, the scale would be 4 to 20.
A “good” Likert scale balances the scale on both sides of a neutral option, creating a less biased measurement. The actual scale labels, as well as the numeric scale itself, may vary.
Our example is a nearly perfect Likert scale. It has one potential flaw, which we’ll discuss later.
So, given this information, when should you use a Likert scale?
To answer that, it’s important to look at how you’d report and analyze the data for this question type. Let’s take a look.
Reporting on Likert Scales
The traditional way to report on a Likert scale is to sum the values of each selected option and create a score for each respondent. Researchers use this score to represent a specific trait—such as satisfaction or dissatisfaction—especially in sociological or psychological studies.
This method of reporting is also quite useful for evaluating a respondent’s opinion of important purchasing, product, or satisfaction features. In these cases, you can use the scores to create a chart showing the distribution of opinion across the population.
For further analysis, you can cross tabulate the score mean with contributing factors.
Important tip: for the score to have meaning, each item in the scale should be closely related to the same topic.
In a customer satisfaction survey, for example, you should ask all your questions about the product together, all the questions about checkout together, and so on.
If you have an item on the scale that doesn’t fit, the total score for the respondent becomes potentially polluted. So you’ll end up spending a great deal of time deciphering the results!
When to Use Likert Scales
This question type is very useful for measuring overall sentiment about a particular topic, opinion, or experience. It also helps collect specific data on the factors that contribute to that sentiment.
Avoid using this form of question (or calling it a Likert scale) when the items are unrelated or when the options don’t form a scale.
As with all other rating and scale questions, we encourage you not to mix scales within your surveys. Choose a particular scale (3 point, 5 point, 7 point, etc.) and use it as your standard through the survey. This will cut down on potential confusion and reduce survey fatigue. It also allows for accurate comparisons within and between your data sets.