Alchemer is a powerful online survey and data collection platform that allows you to perform very advanced analysis, such as the Chi-Square test. Being able to investigate whether the data from two questions are correlated helps market researchers better understand context in their findings.
What is the Chi-Square Test?
The Chi-Square test is a statistical procedure used by researchers to examine the differences between categorical variables in the same population.
For example, imagine that a research group is interested in whether or not education level and marital status are related for all people in the U.S.
After collecting a simple random sample of 500 U.S. citizens, and administering a survey to this sample, the researchers could first manually observe the frequency distribution of marital status and education category within their sample.
The researchers could then perform a Chi-Square test to validate or provide additional context for these observed frequencies.
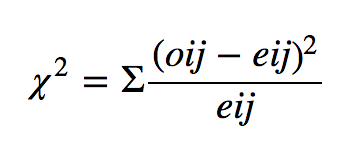
Chi-Square calculation formula is as follows:
When is the Chi-Square Test Used in Market Research?
Market researchers use the Chi-Square test when they find themselves in one of the following situations:
- They need to estimate how closely an observed distribution matches an expected distribution. This is referred to as a “goodness-of-fit” test.
- They need to estimate whether two random variables are independent.
When to Use the Chi-Square Test on Survey Results
The Chi-Square test is most useful when analyzing cross tabulations of survey response data.
Because cross tabulations reveal the frequency and percentage of responses to questions by various segments or categories of respondents (gender, profession, education level, etc.), the Chi-Square test informs researchers about whether or not there is a statistically significant difference between how the various segments or categories answered a given question.
Important things to note when considering using the Chi-Square test
First, Chi-Square only tests whether two individual variables are independent in a binary, “yes” or “no” format.
Chi-Square testing does not provide any insight into the degree of difference between the respondent categories, meaning that researchers are not able to tell which statistic (result of the Chi-Square test) is greater or less than the other.
Second, Chi-Square requires researchers to use numerical values, also known as frequency counts, instead of using percentages or ratios. This can limit the flexibility that researchers have in terms of the processes that they use.
What Software is Needed to Run a Chi-Square Test?
Chi-Square tests can be run in either Microsoft Excel or Google Sheets, however, there are more intuitive statistical software packages available to researchers, such as SPSS, Stata, and SAS.
Check out this article on Exporting Your Survey Data with SPSS to learn how to get started today!