Skip to content
Products
Close Products
Open Products
Products
Survey
Industry leader in flexibility and ease of use
Digital
Collect real-time digital feedback from your website or app
Pulse
Turn noisy text feedback into signals you can act on
Integrations & Automations
Connect data across systems to drive faster outcomes
Dashboard
Turn feedback into results
Services
Research Solutions
Trusted market research that will turn you into the expert
Brand Health Tracker
Brand performance insights at your fingertips
Professional Services
Custom-fit Alchemer Survey and Workflow to your business
Training
Product training for every level, at every stage
Solutions
Close Solutions
Open Solutions
Industries
Government
Education
Non-Profit
Financial Services
Food & Beverage
Retail
Software
Solutions
Customer Experience
Market Research
Employee Engagement
Resources
Close Resources
Open Resources
Blogs
Case Studies
Webinars
eGuides
Resource Library
From the Blog
Introducing Alchemer Research Solutions
Individual Pricing
1-800-609-6480
Support
Login
Request a Demo
Blog
Customer Story
Survey Tips
Solutions
Features
Company News
Press Release
Market Research
Product News
Subscribe to our blog
Alchemer Mobile
Alchemer Mobile
,
Product Management
Lifestyle Apps: 2020 Mobile App Customer Engagement Benchmarks
Alchemer Mobile
,
NPS & CSAT
,
Product Management
,
Product Roadmap
How to Create Better Mobile Surveys
Alchemer Mobile
,
Customer Experience
,
Loyalty & Retention
,
Mobile Marketing
,
Product Management
Visualizing COVID-19’s Impact on Daily App Usage (DAU)
Alchemer Mobile
,
Product Management
Retail Apps: 2020 Mobile Customer Engagement Benchmarks
Alchemer Mobile
,
Product Management
Finance Apps: Mobile Customer Engagement Benchmarks for 2020
Alchemer Mobile
,
Customer Experience
,
Mobile Marketing
,
Product Management
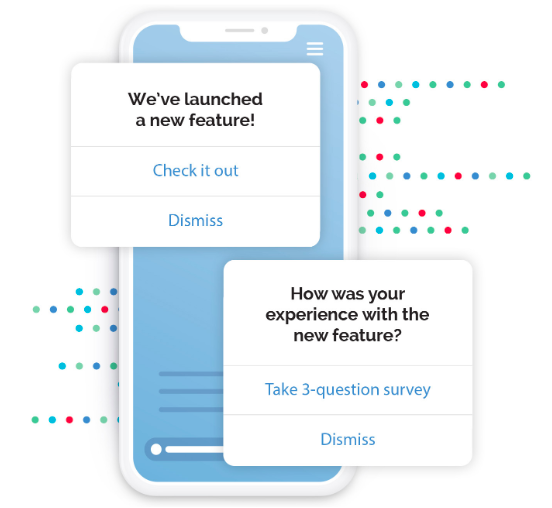
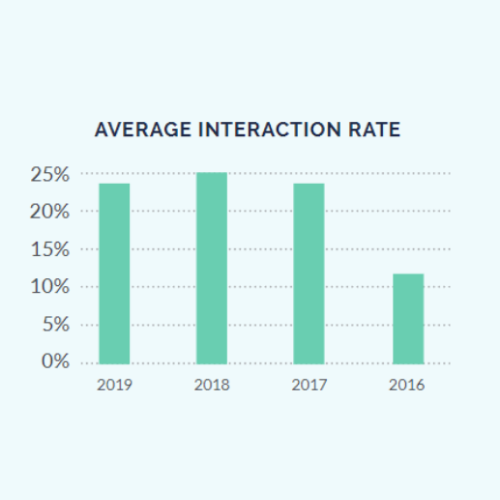
Average Interaction and Response Rates for In-app Mobile Communication
Alchemer Mobile
,
Customer Experience
,
Product Management
Media Apps: 2020 Mobile Customer Engagement Benchmarks
2 min
Alchemer Mobile
,
Mobile Marketing
,
Product Management
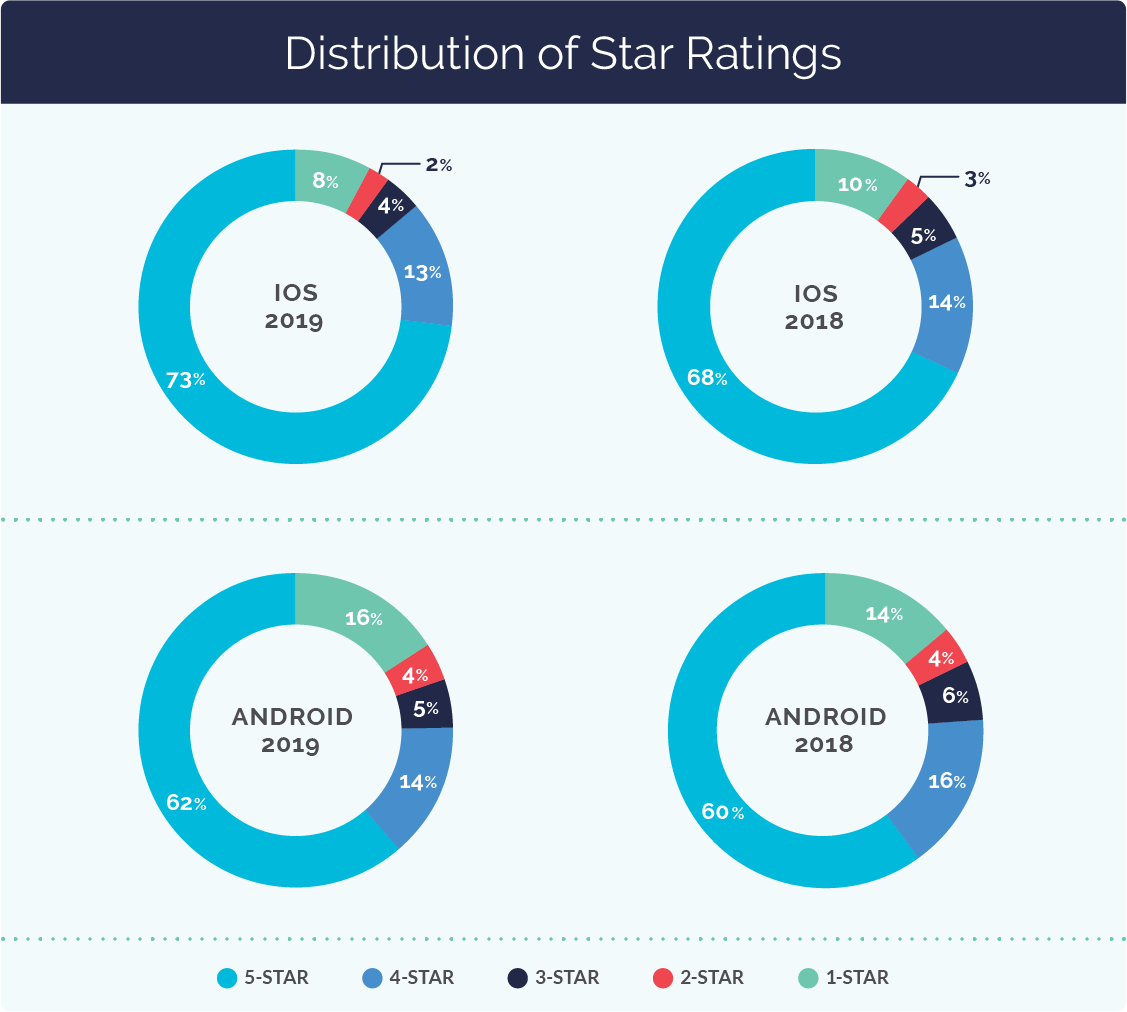
Mobile App Ratings and Reviews: 2020 Benchmarks
Alchemer Mobile
,
Customer Experience
,
Product Management
Mobile App Engagement Benchmark Data for Key Industries Including Finance, Food & Drink, Retail, Media, Travel, and Lifestyle
3 min
Alchemer Mobile
,
Customer Stories
,
Product Management
How to be a Great Product Manager According to Experts at Dropbox, Stripe, and Concur
Alchemer Mobile
,
Customer Experience
,
Mobile Marketing
To Connect with Digital Customers, Brands Must Listen First
Alchemer Mobile
,
Mobile Marketing
,
Product Management
,
Product Roadmap
Tips for a Successful Mobile App Launch
< Previous
Page
1
…
Page
7
Page
8
Page
9
Page
10
Page
11
…
Page
15
Next >
Start making smarter decisions
Contact Sales
Start a Free Trial
Subscribe to our Blog